Proof you're actually
doing the marketing.
Every month you can see exactly what your store put out — content pieces, promotions, campaigns, events promoted, leads captured. Real counts, with any estimate clearly labeled as one.
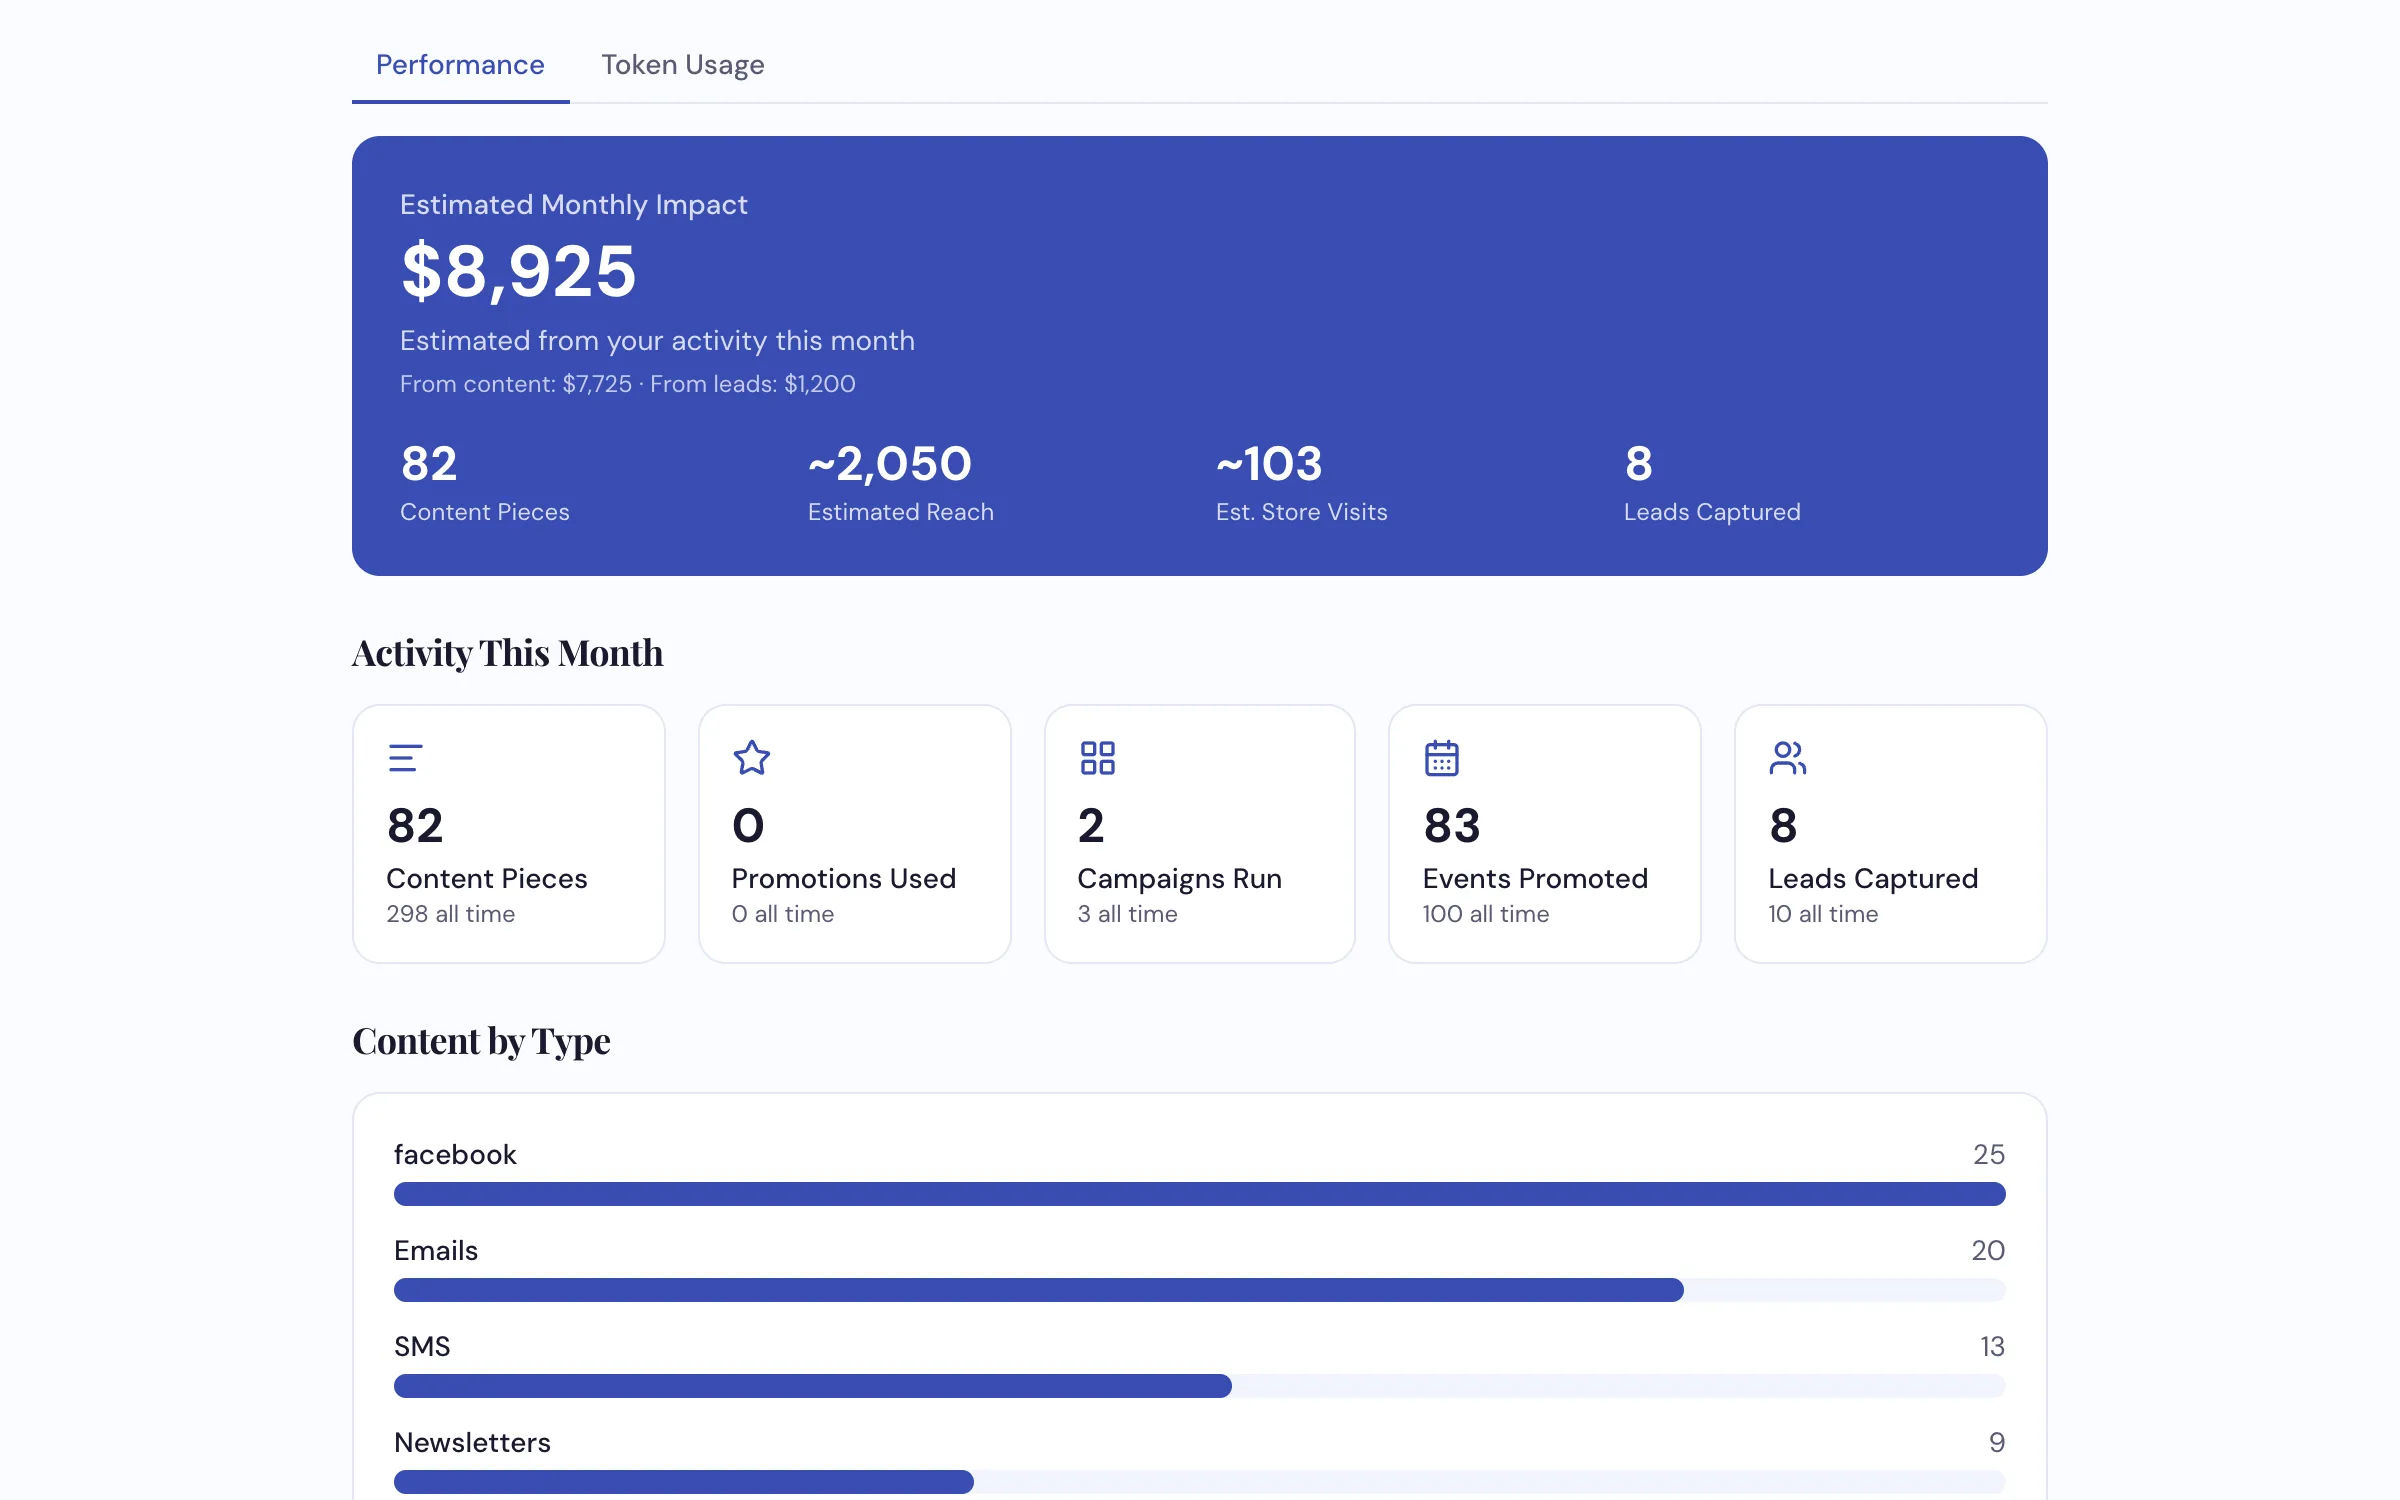
Five numbers, counted rather than guessed — this month against everything you've ever done. The panel on top is an estimate, and says so.
How dealers use it
-
Answer the question you can't currently answer
"How much marketing did we do last month?" In most shops nobody knows — it's spread across a phone, a laptop and somebody's memory. Here it's five numbers on one screen.
-
See which kind of content you keep neglecting
The breakdown by type usually tells the same story: plenty of social, almost no email. Knowing that is what changes it — and email is the one that brings people back through the door.
-
Watch six months, not one
The trend is the useful part. Marketing in a shop is nearly always seasonal and nearly always slips when the shop gets busy. The six-month chart shows you that pattern rather than letting you guess at it.
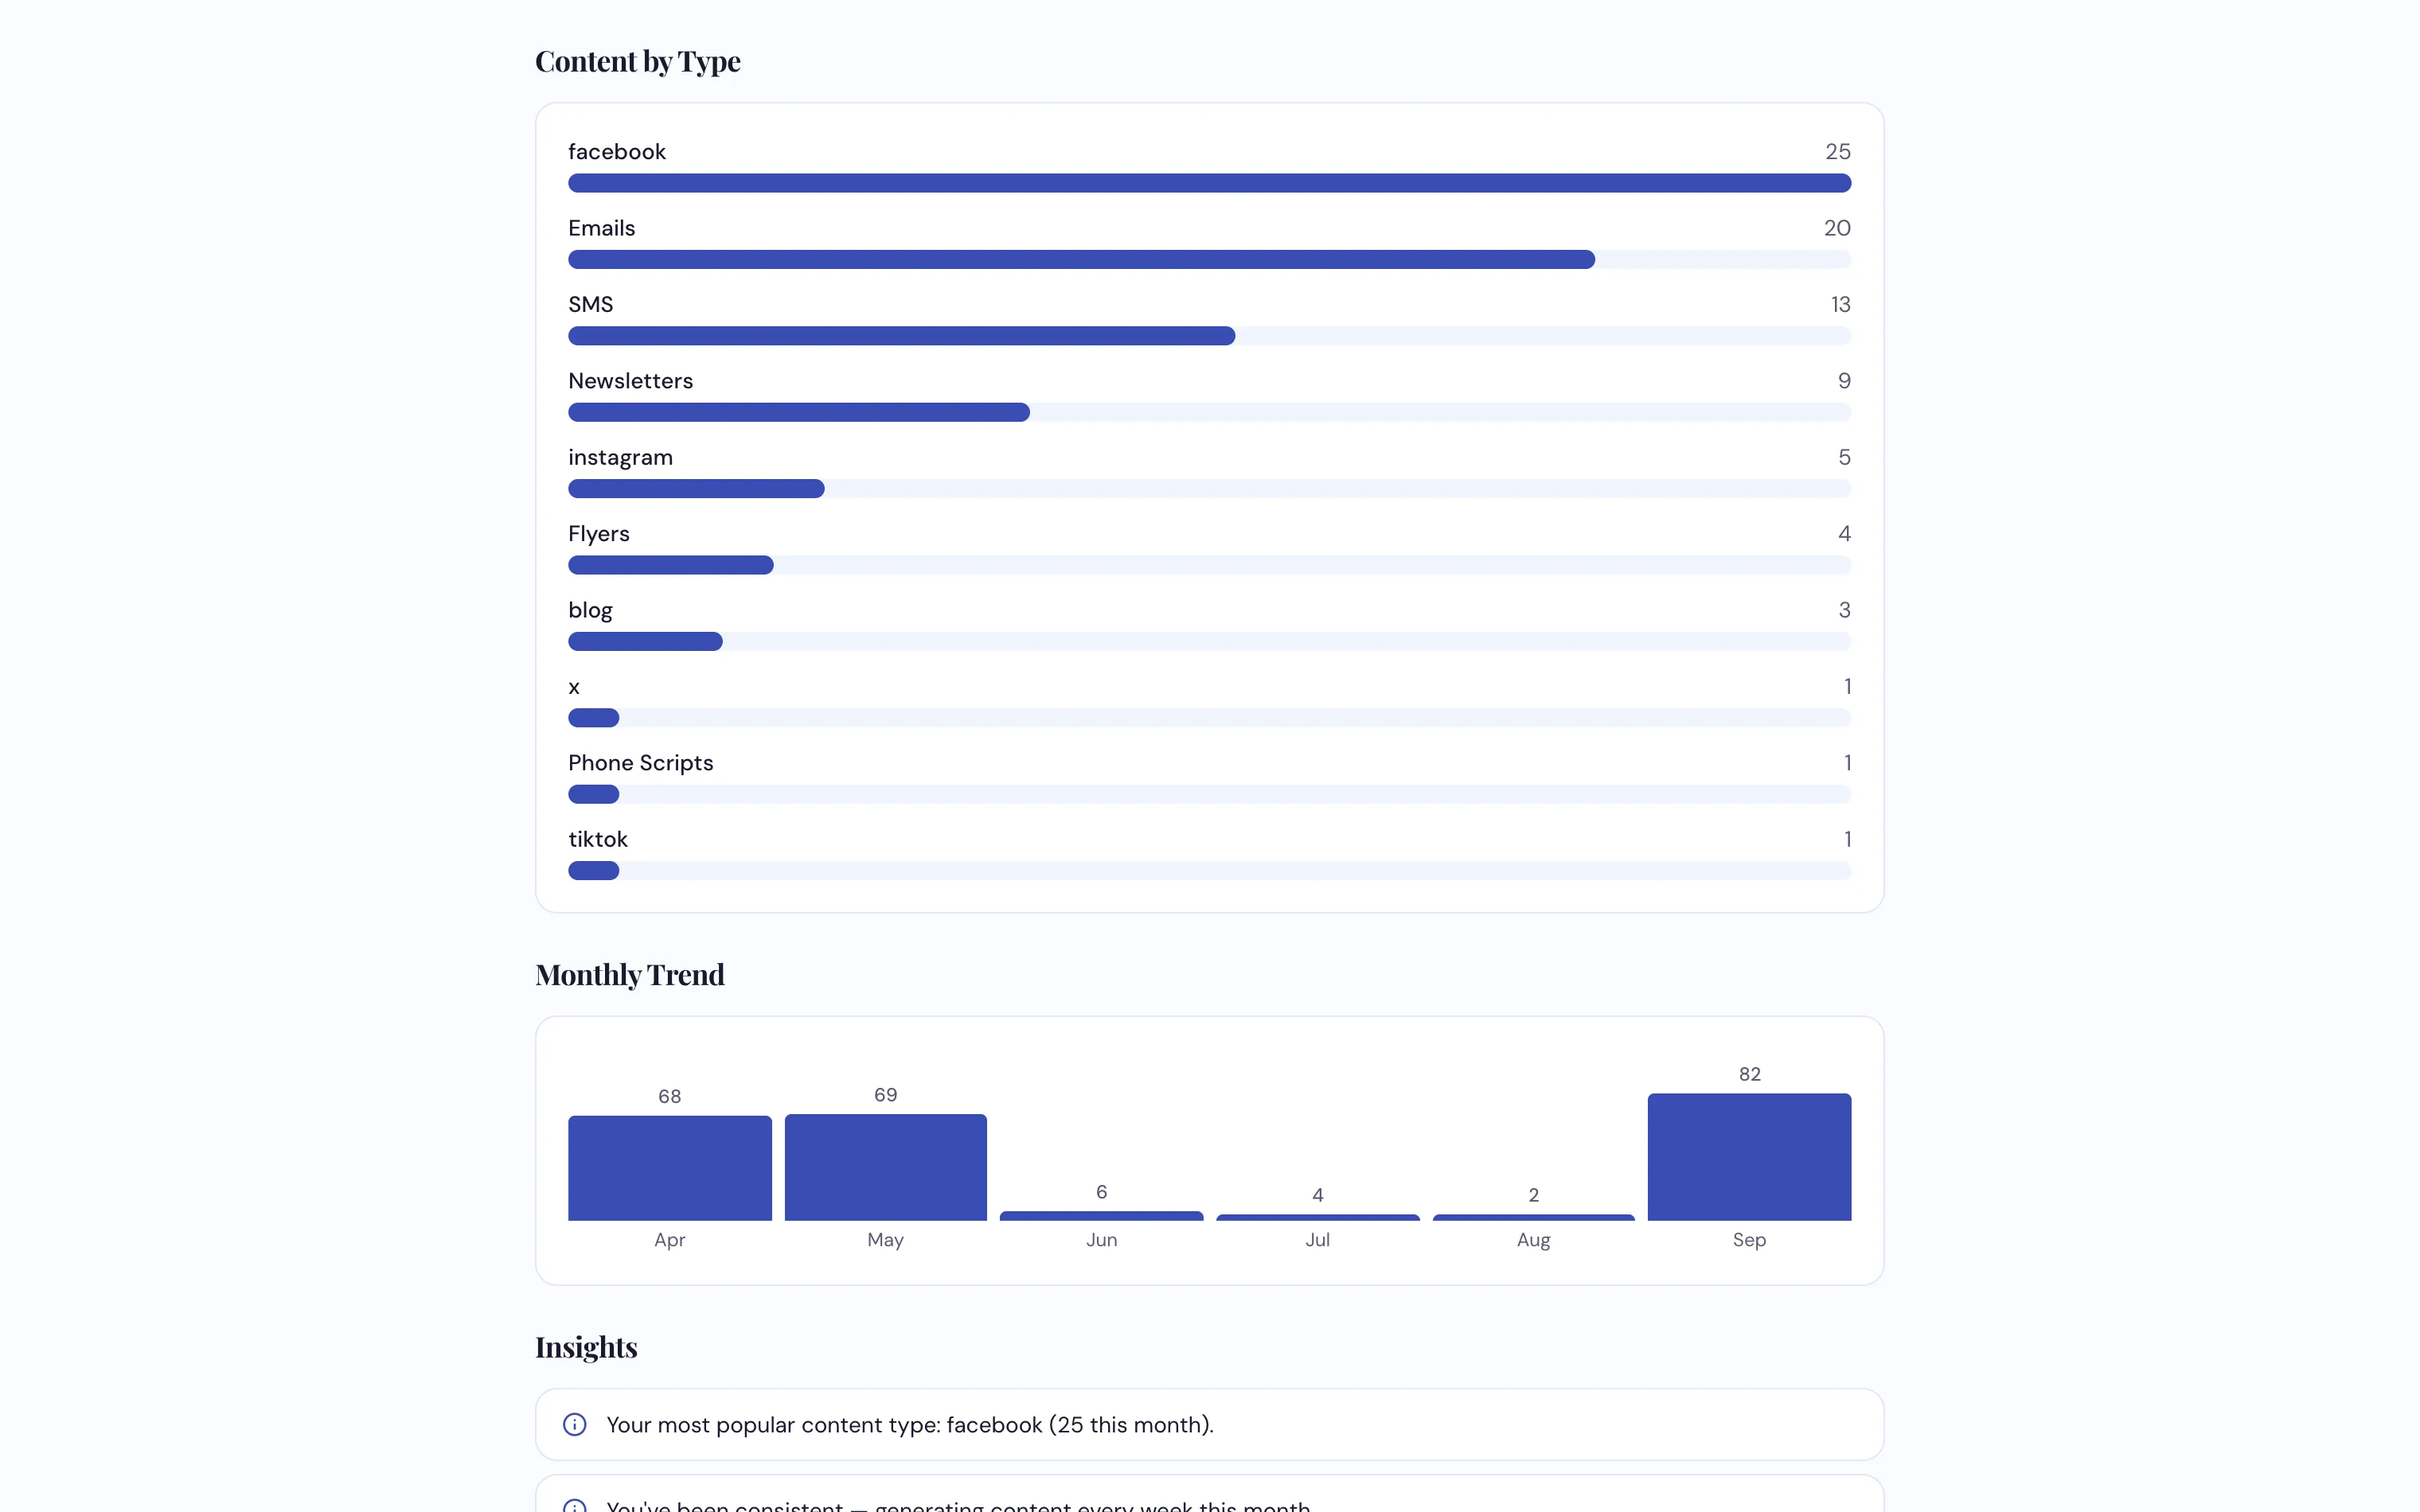
Six months of output. The dips usually line up with your busiest weeks on the shop floor.
What it does
- Five real counts — content pieces, promotions used, campaigns run, events promoted, leads captured
- This month against all time, side by side
- A breakdown by content type, so the gaps are obvious
- A six-month trend of everything you've produced
- An estimated monthly impact — reach, store visits and what it was worth — labeled as an estimate
- Straightforward prompts on what to do next based on what's thin
- Owners and managers see it; you choose which staff do
- Nothing to set up — it counts as you go
See what a month of it looks like
We'll walk through a real dealer's numbers on the call.
Request a Demo